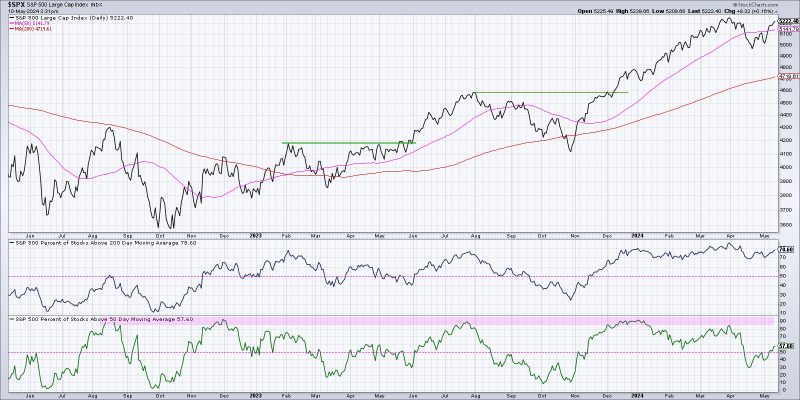
In the realm of financial markets, navigating through the ups and downs can be a daunting task for even the most seasoned investors. The ability to identify and confirm a bullish market trend is crucial for making informed decisions and maximizing profit potential. There are various technical indicators and tools available to assess market direction, but utilizing breadth indicators can provide a comprehensive view of market health and momentum.
1. **Advance-Decline Line (AD Line):**
– The Advance-Decline Line is a breadth indicator that tracks the cumulative sum of advancing and declining stocks in a given market. By comparing the number of advancing stocks to the number of declining stocks, investors can gauge the overall strength of a market trend. A rising AD Line signifies broad-based market participation and indicates a healthy bullish trend. On the contrary, a declining AD Line may signal weakening market breadth and potential underlying weakness in the trend.
2. **New Highs-New Lows Index:**
– The New Highs-New Lows Index measures the number of stocks reaching new highs versus stocks sinking to new lows. This breadth indicator helps investors assess market sentiment and strength by indicating the level of participation in the upward momentum of the market. A high number of new highs relative to new lows is indicative of a robust market trend with widespread strength. Conversely, a large number of new lows compared to new highs may suggest a lack of participation and underlying weakness in the market trend.
3. **McClellan Oscillator:**
– The McClellan Oscillator is a technical indicator that uses advancing and declining issues on an exponential moving average to generate signals of market breadth. It helps investors identify overbought or oversold conditions in the market, providing valuable insights into potential trend reversals. A positive McClellan Oscillator reading indicates broad market strength and supports a bullish market trend. Conversely, a negative reading suggests underlying weakness and potential bearish sentiment in the market.
By incorporating these breadth indicators into their analysis, investors can gain a more holistic understanding of market dynamics and confirm a bullish trend with greater confidence. While no single indicator can guarantee market success, a combination of breadth indicators can offer valuable insights into market breadth, sentiment, and momentum. As always, it is essential for investors to conduct thorough research, exercise caution, and consider various factors before making investment decisions in the dynamic world of financial markets.


