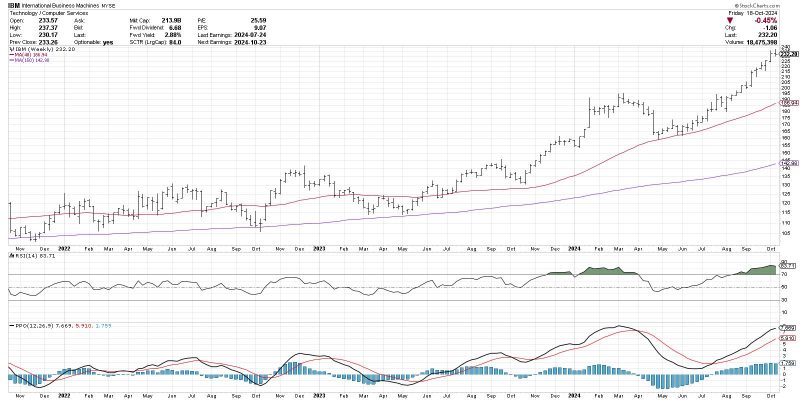
The MACD Histogram: A Powerful Tool for Anticipating Trend Changes
The Moving Average Convergence Divergence (MACD) is a popular technical analysis indicator that traders use to identify potential trend changes in the financial markets. What sets the MACD Histogram apart from the traditional MACD is its ability to offer a more refined view of market momentum and possible reversals.
Understanding the MACD Histogram
The MACD Histogram is derived from the MACD line and the signal line. It plots the difference between these two lines as a histogram, providing a visual representation of the momentum of the trend. When the MACD line crosses above the signal line, the histogram moves above the zero line, indicating a bullish momentum. Conversely, when the MACD line crosses below the signal line, the histogram moves below the zero line, suggesting a bearish momentum.
Anticipating Trend Changes
The MACD Histogram is a powerful tool for anticipating trend changes as it offers a clearer indication of momentum shifts in the market. Traders look for divergences between the price action and the MACD Histogram to identify potential trend reversals. For instance, if the price is making higher highs while the MACD Histogram is making lower highs, it could signal a weakening bullish momentum and a potential trend change to the downside.
Additionally, traders can use the MACD Histogram to confirm trend changes identified by other technical indicators. By waiting for the MACD Histogram to cross above or below the zero line following a crossover of the MACD and signal line, traders can increase the reliability of their trading signals.
Risk Management and Confirmation
As with any technical indicator, it is essential to practice proper risk management when using the MACD Histogram. Traders should consider placing stop-loss orders to limit potential losses in case the anticipated trend change does not materialize. Furthermore, incorporating other technical analysis tools such as support and resistance levels, trendlines, and volume can help confirm signals generated by the MACD Histogram.
In conclusion, the MACD Histogram is a valuable tool for traders looking to anticipate trend changes in the financial markets. By providing a clearer view of market momentum and potential reversals, the MACD Histogram can help traders make more informed trading decisions. When used in conjunction with other technical indicators and proper risk management, the MACD Histogram can be a powerful ally in a trader’s toolkit.


