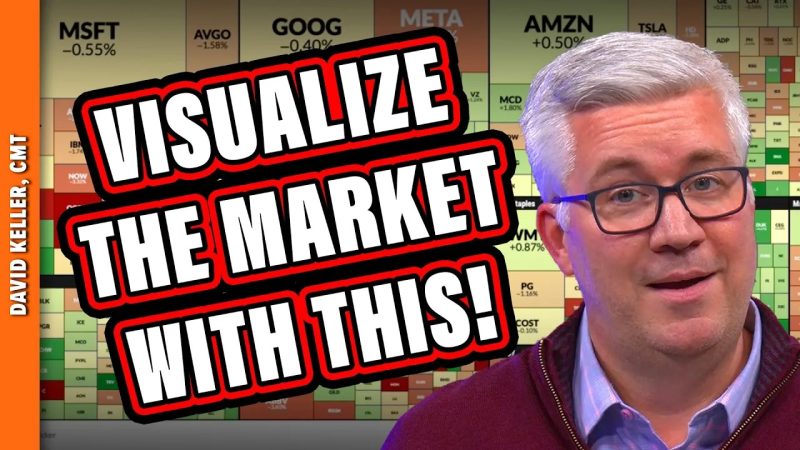
Market Visualization Tools: A Game-Changer for Investors
Market visualization tools have become indispensable for both novice and seasoned investors in navigating the complex landscape of financial markets. These innovative platforms provide a wealth of information through interactive charts, graphs, and maps that empower users to make informed decisions and identify trends that may influence their investment strategies. Among the plethora of options available, some stand out as game-changers for investors seeking a competitive edge in the ever-evolving world of finance.
One such standout tool is TradingView, a widely popular platform that caters to traders and investors alike with its comprehensive suite of visualization features. TradingView offers real-time data on various asset classes, including stocks, forex, cryptocurrencies, and commodities, presented in visually appealing and intuitive charts. Users can customize their charts with a wide range of technical indicators and drawing tools to conduct in-depth analysis and gain insights into market trends. The social aspect of TradingView allows users to share ideas, collaborate with others, and draw inspiration from a vibrant community of traders.
For those looking to delve into the world of cryptocurrencies, Coinigy is a powerful market visualization tool tailored specifically for this dynamic asset class. Coinigy provides a unified platform for accessing and analyzing data from multiple cryptocurrency exchanges, allowing users to track their portfolios, set alerts, and execute trades seamlessly. The platform’s advanced charting capabilities enable users to overlay multiple indicators, compare different cryptocurrencies, and monitor market movements in real time, all from a single dashboard. With its user-friendly interface and robust features, Coinigy is a valuable asset for crypto enthusiasts seeking to stay ahead of the curve.
Another noteworthy market visualization tool is TrendSpider, which leverages advanced algorithms and automation to simplify the technical analysis process for traders. TrendSpider’s innovative charting technology automatically identifies key support and resistance levels, chart patterns, and trendlines, saving users time and effort in conducting manual analysis. The platform’s dynamic alerts and backtesting capabilities empower traders to stay on top of market developments and validate their trading strategies with historical data. By combining cutting-edge technology with user-friendly design, TrendSpider equips traders with the tools they need to make informed decisions and maximize their trading performance.
In conclusion, market visualization tools have revolutionized the way investors interact with financial data, offering a comprehensive and user-friendly approach to analyzing markets and making informed decisions. Whether you’re a seasoned trader or a beginner looking to explore the world of finance, incorporating these innovative tools into your investment toolkit can help you navigate the complexities of the market with confidence and precision. With platforms like TradingView, Coinigy, and TrendSpider leading the way in market visualization, investors have access to a wealth of information and analysis at their fingertips, empowering them to succeed in today’s fast-paced and competitive trading environment.


