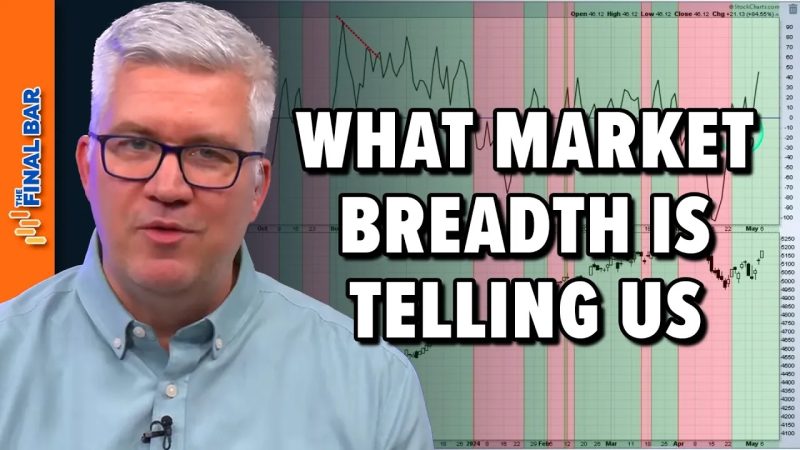
Market Breadth Indicator: Understanding Its Importance and Impact
When it comes to monitoring and analyzing the stock market, there are numerous indicators and tools available to investors and traders. One of the often-overlooked but highly valuable indicators is market breadth. Market breadth provides valuable insights into the overall health and direction of the market by measuring the breadth and participation of stocks in a given market index. While there are various market breadth indicators available, one of the most commonly used and effective indicators is the Advance-Decline Line.
The Advance-Decline Line is a simple yet powerful market breadth indicator that tracks the number of advancing stocks versus declining stocks in a particular market index. By comparing the number of stocks moving higher versus lower, the Advance-Decline Line provides a clear picture of market participation. A rising Advance-Decline Line indicates broad market strength, with a majority of stocks participating in the uptrend. Conversely, a declining Advance-Decline Line suggests weakening market breadth, where fewer stocks are driving the market higher.
One of the key advantages of using the Advance-Decline Line is its ability to provide early warning signs of potential market reversals. When the Advance-Decline Line diverges from the price index, it can signal underlying weakness or strength in the market that may not be reflected in stock prices. For example, if the market index is reaching new highs but the Advance-Decline Line is trending lower, it could indicate that the market rally is losing momentum and that a pullback or correction may be imminent.
Moreover, the Advance-Decline Line can also help investors gauge the overall market sentiment and investor confidence. A strong and rising Advance-Decline Line suggests that investors are optimistic and that the market rally is broad-based. On the other hand, a declining Advance-Decline Line could indicate growing investor caution and a lack of conviction in the market rally.
In addition to monitoring the overall market breadth, investors can use the Advance-Decline Line to identify potential buying or selling opportunities. For instance, when the Advance-Decline Line is moving higher and reaching new highs along with the market index, it confirms the strength of the current uptrend and presents a bullish signal for investors. Conversely, if the Advance-Decline Line starts to trend lower while the market index remains elevated, it could be a warning sign of a potential market downturn and prompt investors to reassess their positions.
In conclusion, market breadth indicators such as the Advance-Decline Line play a crucial role in helping investors navigate the complexities of the stock market. By analyzing the participation and breadth of stocks in the market index, investors can gain valuable insights into market trends, sentiment, and potential market reversals. The Advance-Decline Line, in particular, stands out as a reliable and effective indicator that can guide investors in making informed decisions and staying ahead of market movements. By incorporating market breadth analysis into their investment strategy, investors can enhance their understanding of the market dynamics and improve their overall investment performance.


